Follow up progress in volume to ensure jobsite profitability
360 view on all processes, past and present.
Cloud solution, accessible from computers and compatible devices.
Get an instant progress updates whenever you need it.
3D visualisation of your jobsite – easy to use and understand.
Every day is a new day
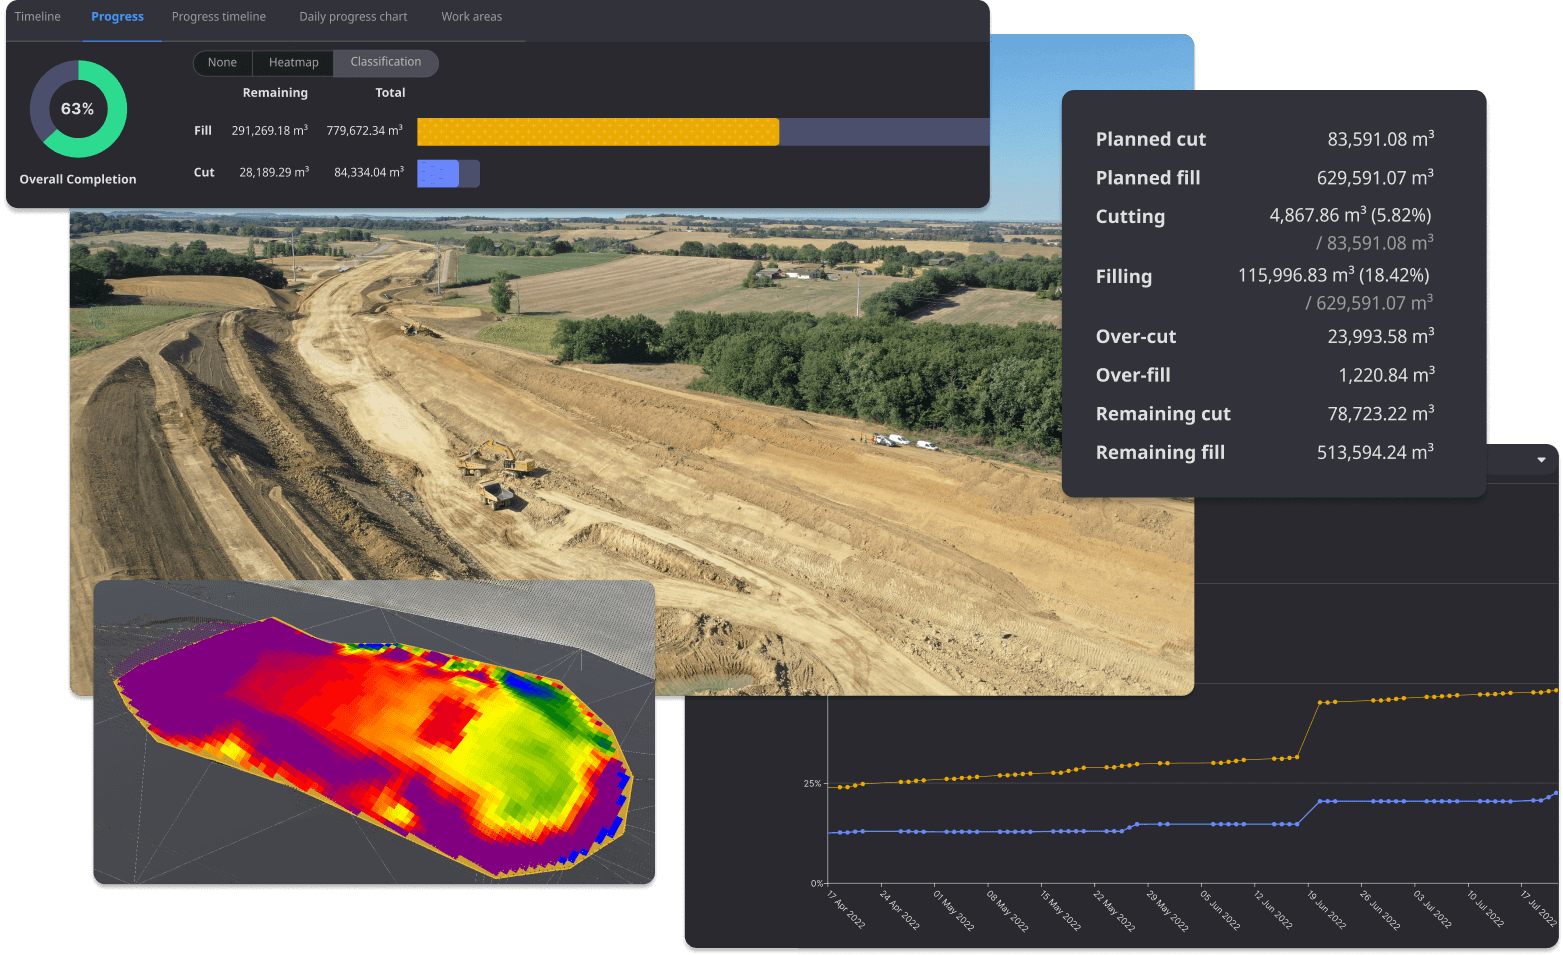
Ever wondered if the volume moved today has matched up to your planning? Curious about how much it cost to move a cubic meter? Closely monitoring the performance of your jobsite(s) is a key factor in making sure profitability remain on track!
- Overall completion automatically calculated
- Progress logs to understand overall completion from chart to timeline
- Visualise completed/remaining work, cut/fill, overcut/overfill with heatmap
Our site managers now have the ability to directly measure the cubic meters moved and do invoices without the help of a surveyor.
Chris Horn, Technology Manager at HB Golf
- Volume calculation tool box for both small and big measurements
- 2D/3D cross section to check survey-to-survey elevation changes
- No specialist requirement
An (almost) real-time digital counterpart of your physical site integrating all terrain-related datasets.
- Photogrammetry for full terrain survey
- LiDAR for original ground survey
- Machine for daily as-built information
- Traditional surveying methods
As a site manager overseeing multiple sites in parallel, having a daily updated terrain status of all my sites saves me two days of time budget per month.
Thomas Vent, Jobsite Manager ECOSOIL Nordwest GmbH
Take a peek and see how Dashboard could work for you
Let a site manager walk you through how Dashboard is applied on his jobsite in real life!
The Connected Site
From mountain peaks to flat fields, earthmoving is all about taking an existing terrain and reshaping it to a totally new surface. That’s why our Dashboard is the key tool lying at the heart of terrain visualisation. Receive a clear visual image of your jobsite terrain while helping you measure and monitor terrain changes towards the planned final surface.
Automatic data collection from the field
Our amazing suite of IoT tools allows you to quickly gather data and provide it the Dashboard in near-real time, eliminating the need for manual labor.
Smart Construction Edge
On-site processing of drone data at lightning speed
Smart Construction Quick3D
Quick mobile lidar scanning to make detailed updates in your digital twin
Smart Construction 3D Machine Guidance
3D machine guidance collecting daily as-constructed data
Optimise and simulate your ongoing processes
Using the Dashboard data, our Simulation tool allows digital rehearsals to happen in the virtual space, where different combinations of equipment and soil distributions can be tested out before they start happening onsite.
Get up-to-date with your daily feed of info once the project starts – adjust plans based on construction changes or lost time as needed.
Optimize operations through an eternal loop of Plan-Do-Check-Act (PDCA) with the help of expert advice tailored just for you.
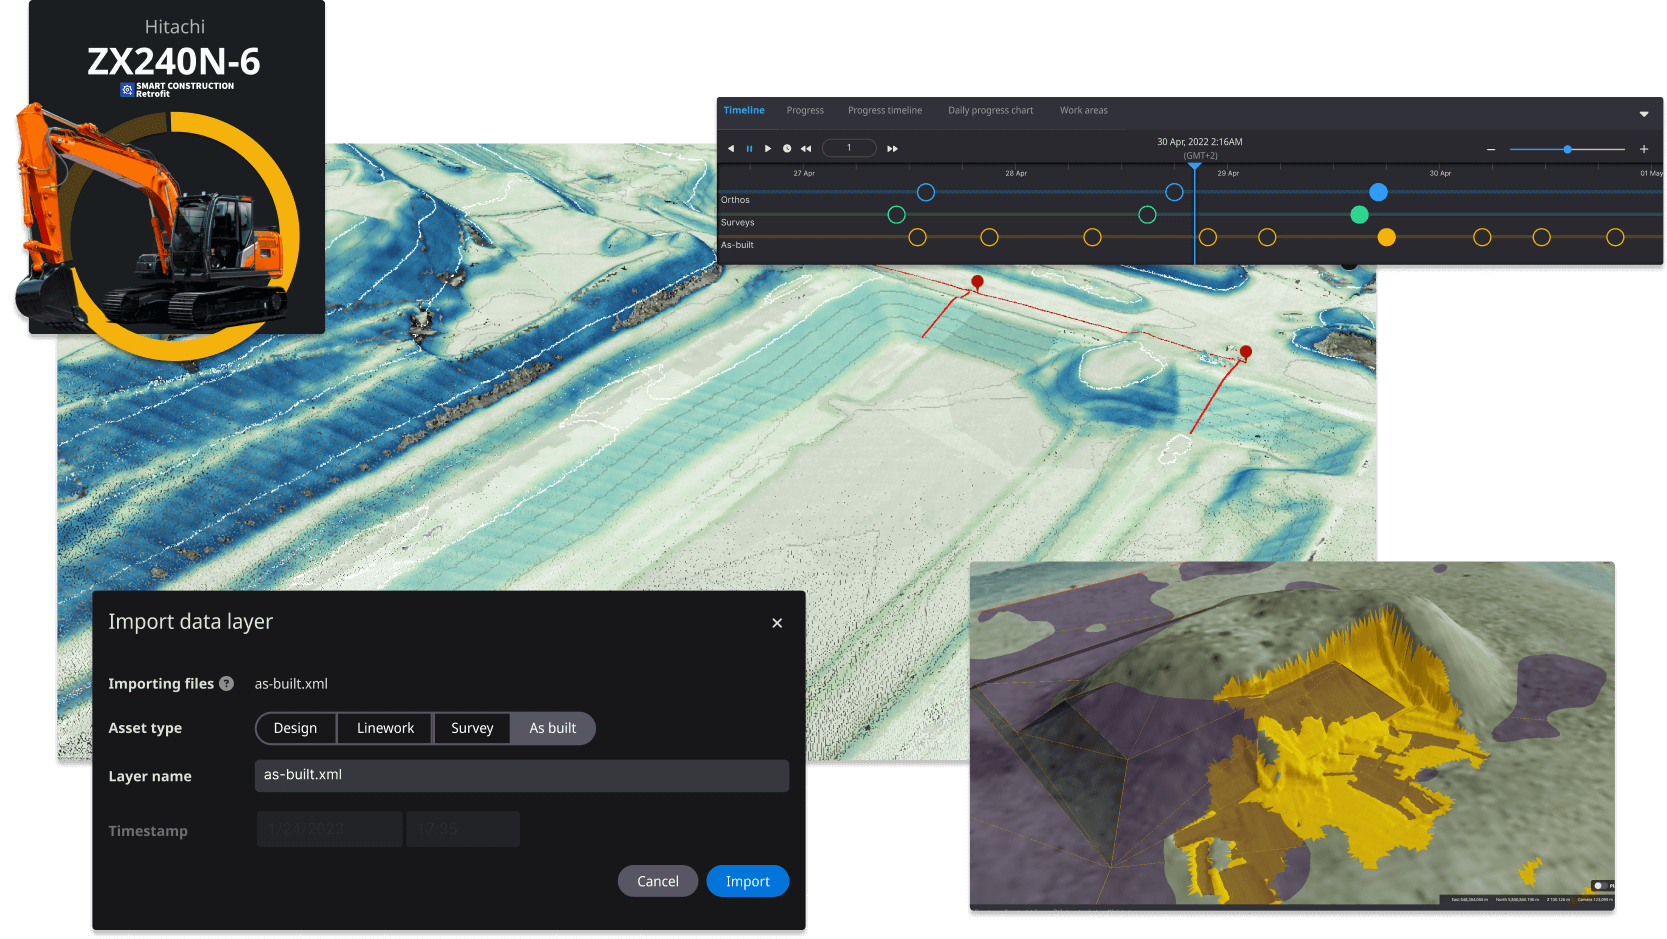
Use your intelligent Machine Control (iMC) to survey
Unlock the highest levels of productivity with powerful analytical insights from your iMC. Now you can easily visualize and measure terrain evolutions, thanks to its seamless integration into the Dashboard!
A handy measurement tool for everyone
With a 3D map always up to date, you can do all kinds of calculations right here on your jobsites’ digital twin. The volume of a stockpile, the length of a sewage line, or ground-level estimations, obtain all these measurements in a matter of seconds, without waiting on an expert.
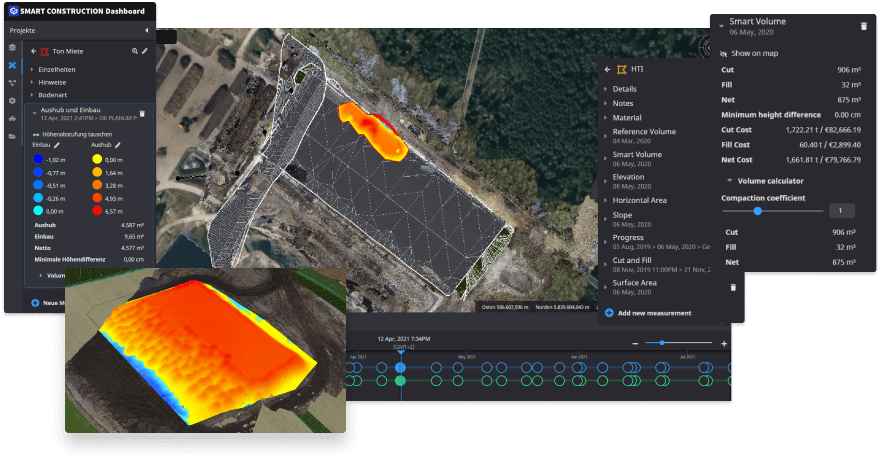
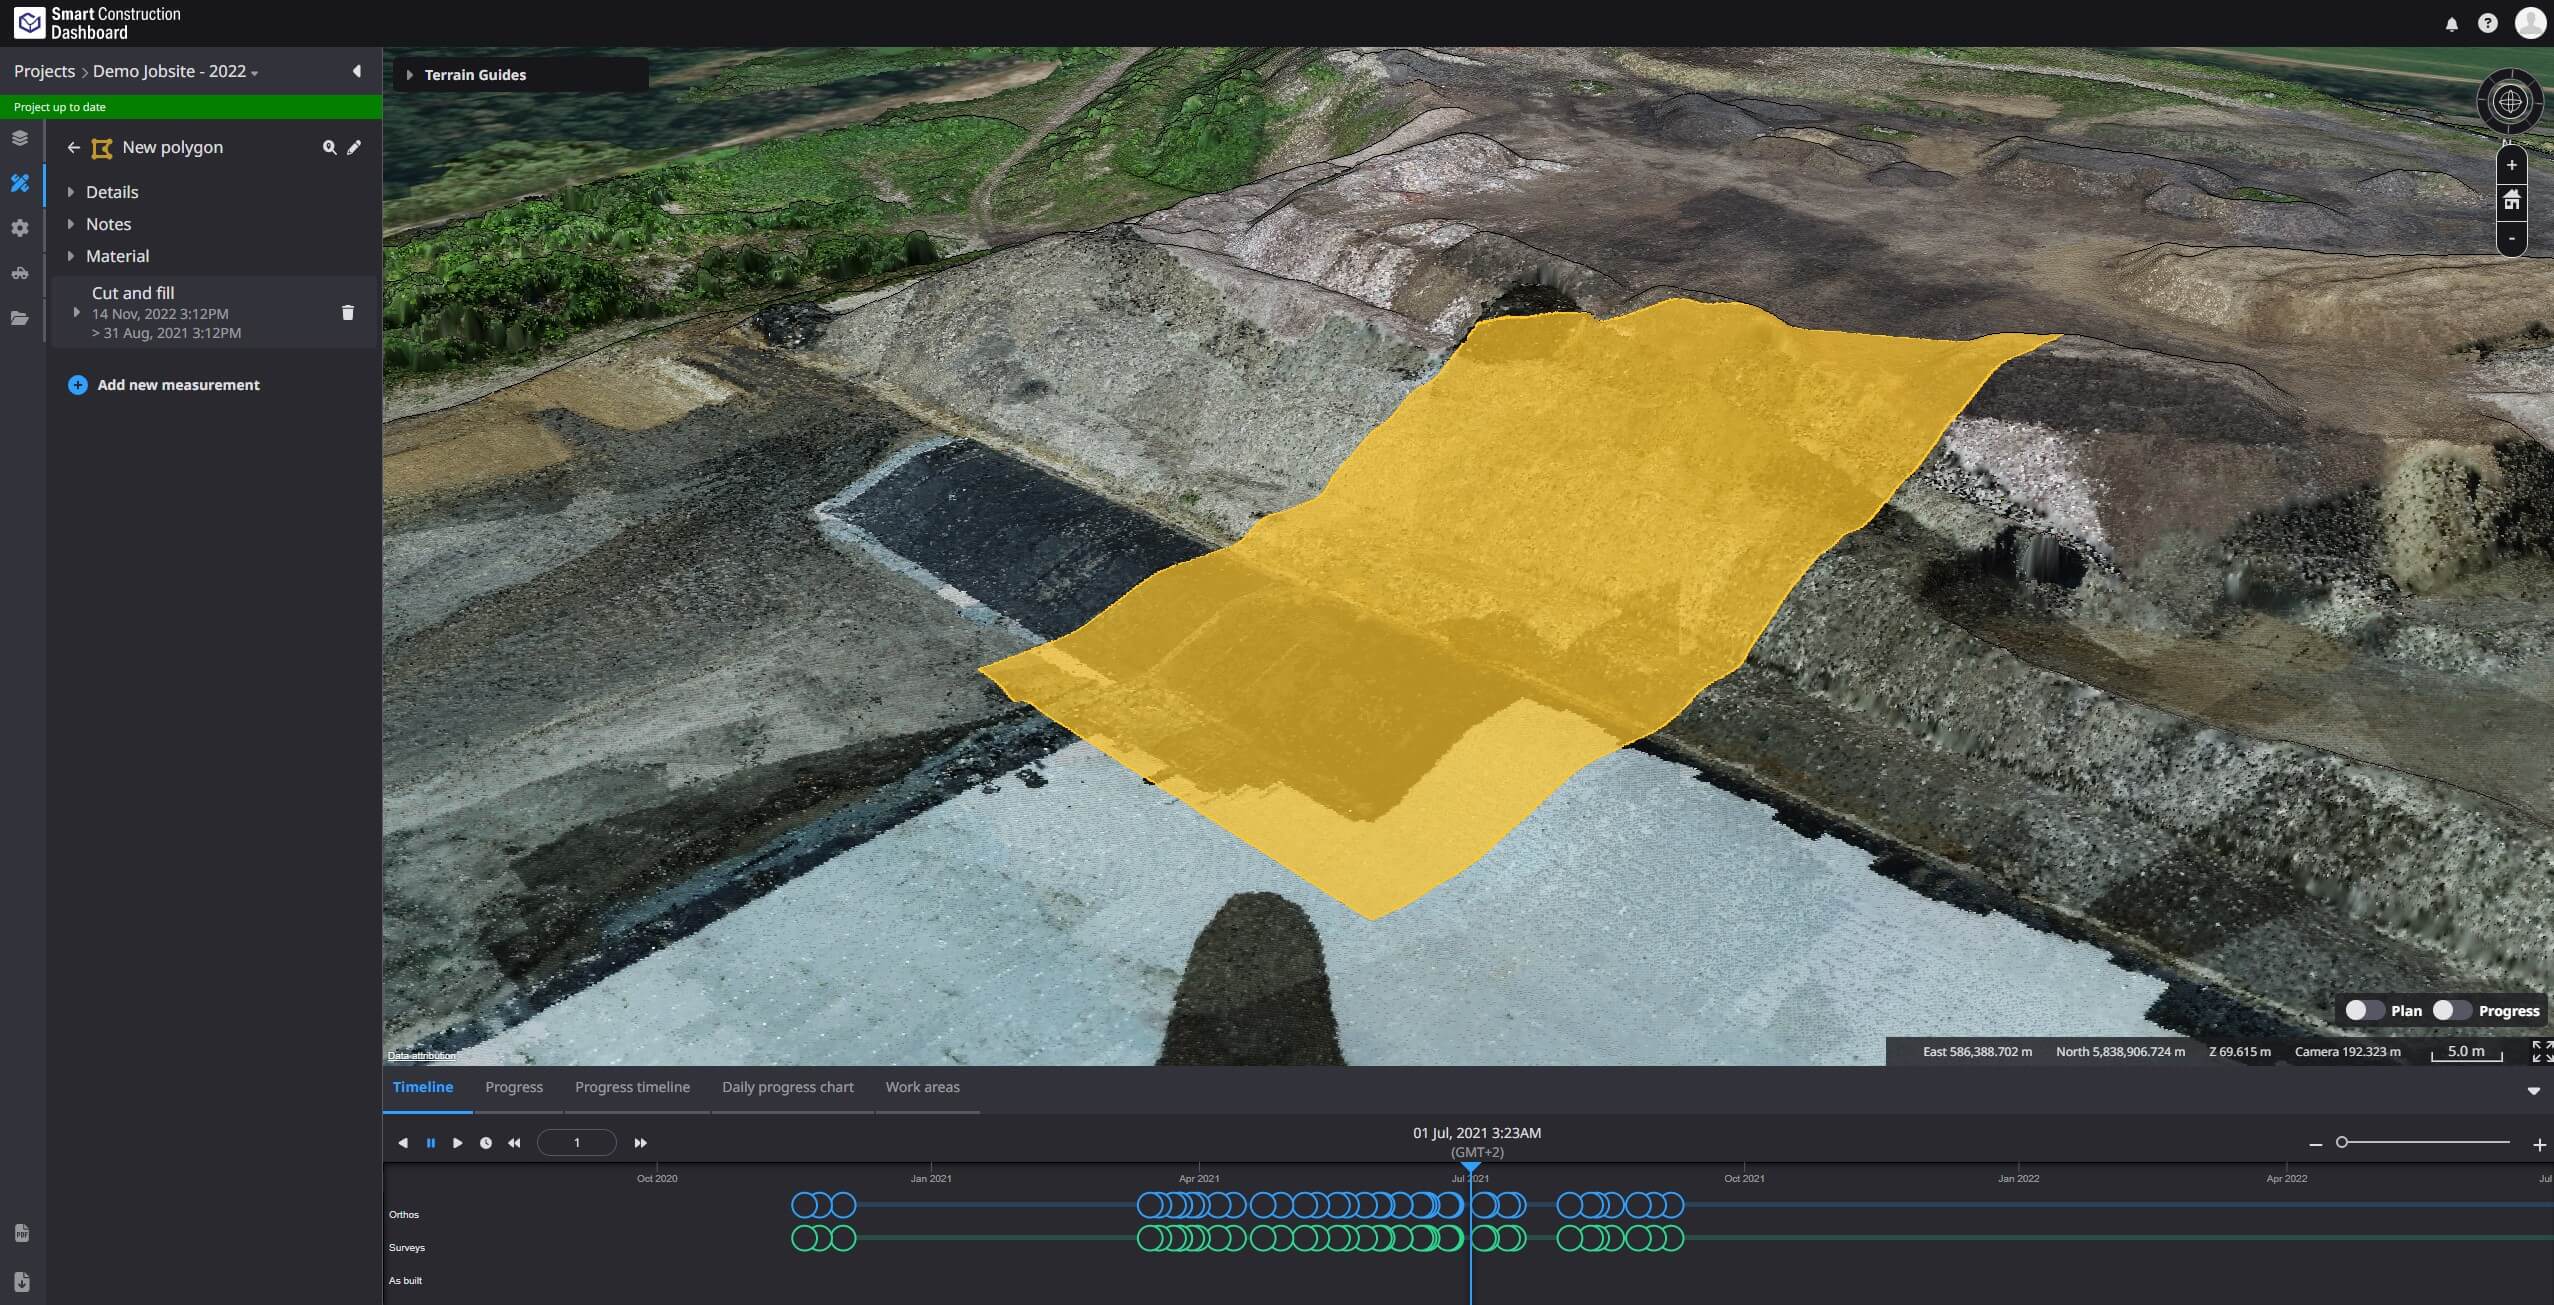
Cut-and-Fill Volume
Make accurate, frequent and safe cut-and-fill volume calculation at every stage of your construction project.
- Cut/fill visualisation with heatmap
- Measure between initial surface, as-built and design
- Monitor productivity and profitability with accurate survey data
- For earthmoving, landfill and quarry projects
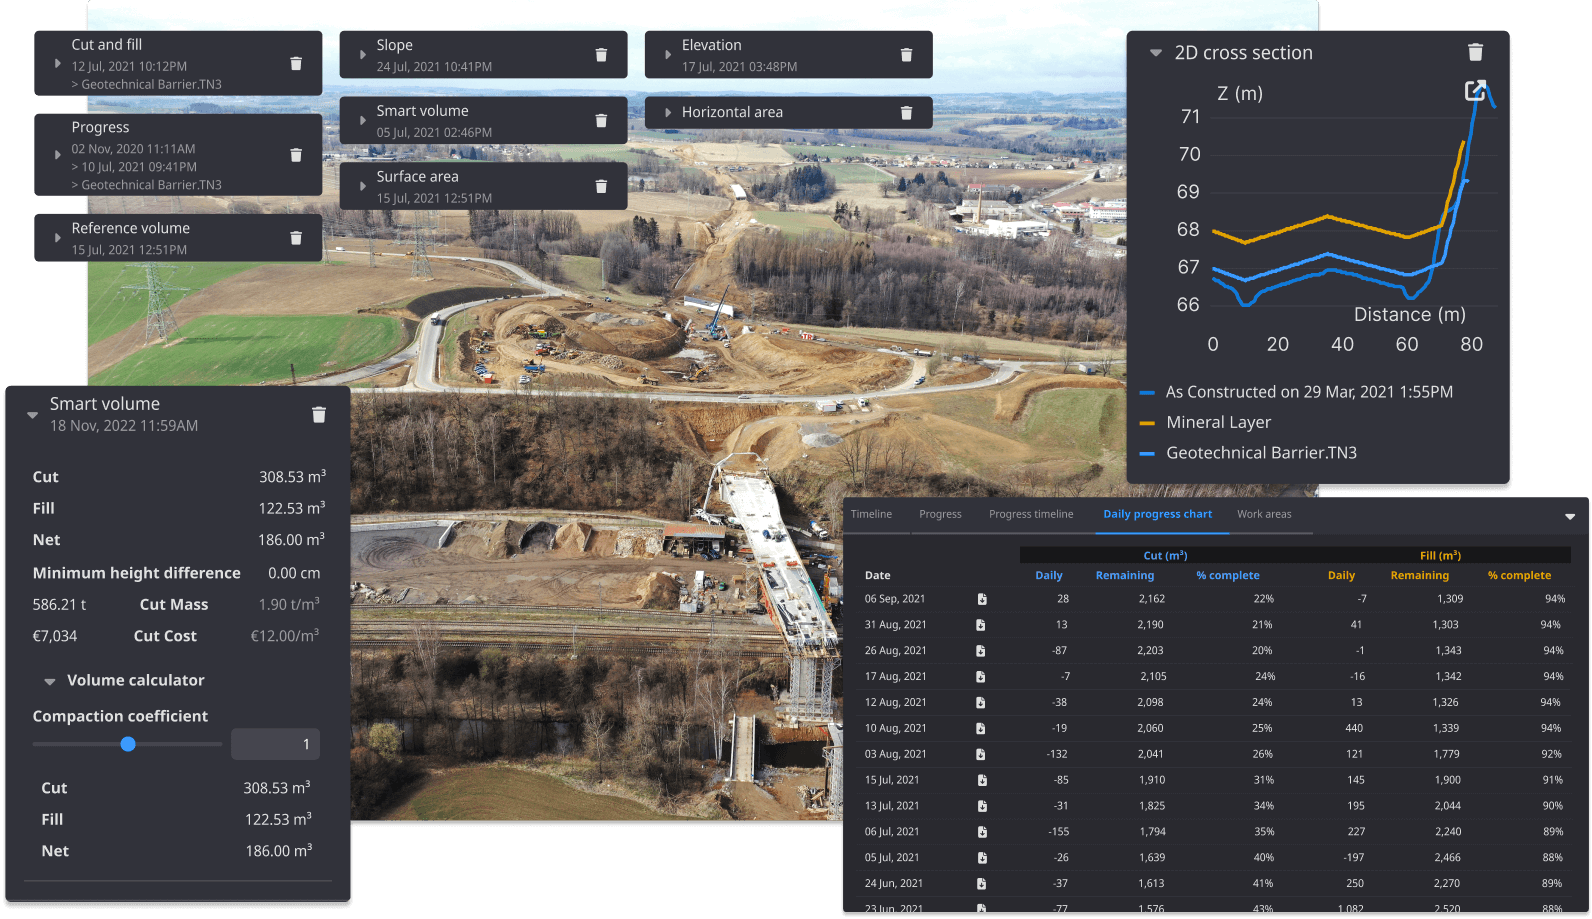
2D and 3D Cross Section
Visually compare multiple surfaces with 2D and 3D cross section by simply clicking on two points.
- Check elevation differences between multiple 3D surfaces
- Check heights along the line by moving your mouse pointer
- As easy as drawing a line with two clicks
- Estimate and track earth moving works
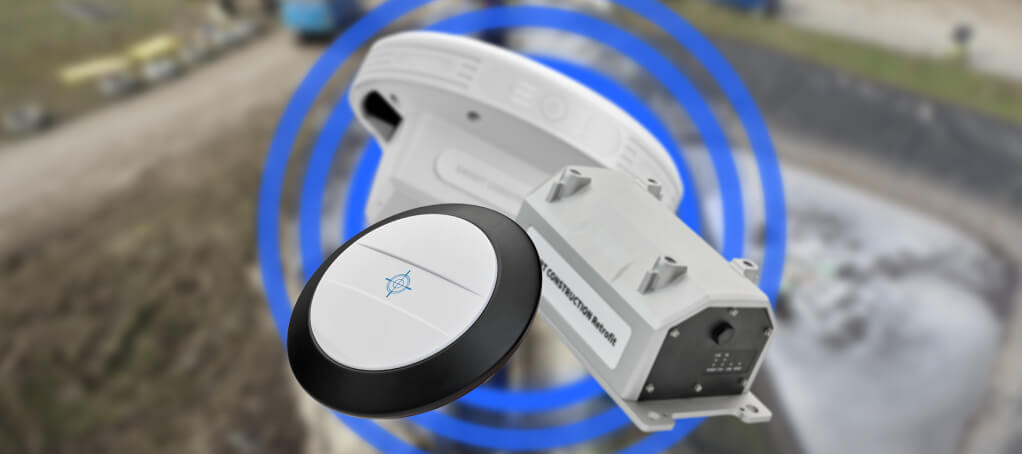
Use your machine to survey
Smart Construction Dashboard automatically visualises as-built data coming from excavators equipped with Smart Construction Retrofit Kit and Komatsu intelligent machines every 24 hours. Get the latest terrain and work progress data while your machines are getting their job done.
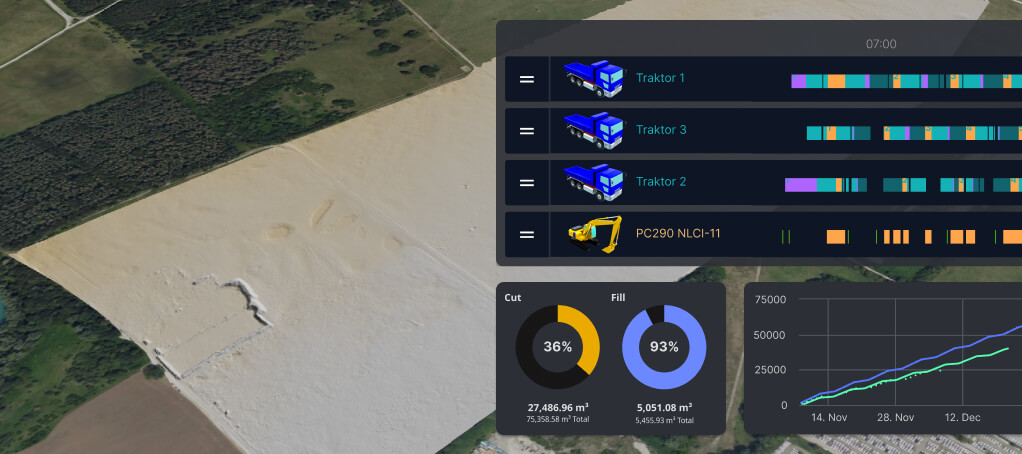
Track work progress
Jobsite progress has never been easier to understand. Make better decisions based on accurate insights into work progress and productivity.
- Visually compare latest terrain with design and see what's left to be done
- Monitor productivity based on survey-to-survey comparison
- See how work progresses over time, no more guesswork
- Adjust machine, material and people allocation plans with latest jobsite data
Slope and Elevation
Easily visualise and calculate slope and elevation. Make sure you are always constructing towards design.
- Visualise slope and elevation with heatmap
- Make sure you are constructing on the right slope and level
- Spot errors and mistakes before they become expensive
- Save time and reduce safety risks
file formats
One single platform for all your design and survey data.
As-built